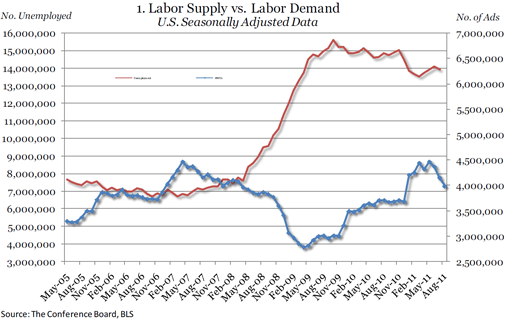
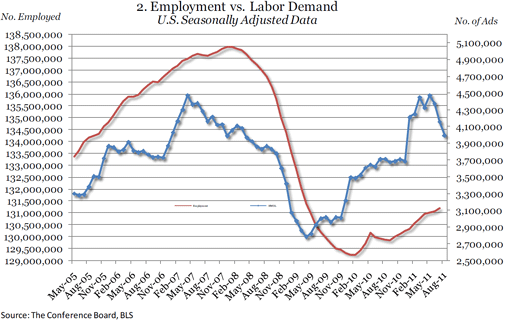
- Following an impressive start in Q1, labor demand pulls back in Q2 and into Q3.
- Nationally, there are just under 10 million (9.8 million) more unemployed workers than advertised vacancies.
“Following a very strong 1st Quarter (+763,000), labor demand has fallen off in the 2nd Quarter and into the 3rd Quarter (-456,000), reducing the earlier gains,” said June Shelp, Vice President at The Conference Board (Chart 1). Overall, 2011 is still showing a 308,000 increase in labor demand, but the average monthly gain this year (+38,000) is less than last year’s average monthly gain at this point (+62,000). The slowdown in labor demand is not good news for job-seekers in a number of occupations. Labor demand has stalled over the last few months, both for construction workers, where there are almost 19 unemployed job-seekers for every advertised position, and for production workers, where there are 8 unemployed for every vacancy.


REGIONAL AND STATE HIGHLIGHTS
In August:
- Like the U.S., many States now have flat or downward trends
- All 4 regions see large drops in August; South experiences largest drop
In August, the Midwest posted the smallest decline, down 36,000, reflecting drops in all but one of its large States that were partially offset by increases in a number of the States with smaller populations. Missouri was the only large State to post an increase, up 1,100, after a combined decrease of 3,800 in June and July. Among the other large States, Illinois declined 11,500 in August following a similar drop in July. Next was Michigan with a drop of 7,200, more than twice its July decline. Ohio fell 5,800 after a drop of 6,400 in July. Minnesota was down 3,100, less than half of its July decline, while Wisconsin experienced a slight decline of 1,200. Among the less populous States in the region, Iowa rose 1,500 and Indiana dropped 4,400 to a total of 63,800. North Dakota and South Dakota posted August gains of 1,000 and 2,500 respectively.
In August, labor demand in the West was down by 37,900. The largest monthly drop in online advertised vacancies was in California, down 19,400 to a total of 440,400. Arizona posted a decline of 4,800, and Colorado dropped 3,300. Washington State gained a mere 200. Other States in the West posting declines included Utah, down 2,900, Nevada, down 1,200, New Mexico, down 1,200, and Idaho, down 900.
The Northeast was down 42,400. Among the large States in the region, Pennsylvania experienced the only gain, up 6,300, to 179,200. New York experienced a large loss of 20,900 to 233,300 advertised vacancies. Massachusetts dropped 8,100, and New Jersey fell 7,300. Connecticut dropped by 3,700, New Hampshire fell 2,500, Rhode Island declined by 1,700, and Vermont lost 400.
In August, the South posted the largest regional decline, 68,100, reflecting drops in all of the large States. Leading the decline was Florida with a drop of 14,700 to 216,900; this was in line with its June drop whereas its July drop was very slight (-600). Next was Texas, down 12,200 to 268,900, for a combined 3-month drop of 44,200. Maryland declined by 8,900 to 95,400; Georgia fell 8,100 to 101,600. Virginia lost 6,400, and North Carolina dropped 4,400. Among the smaller states in the South, Alabama fell by 2,900, Tennessee dropped 2,700, Oklahoma lost 1,800, and Arkansas dipped a mere 100.
The Supply/Demand rate for the U.S. in July (the latest month for which unemployment numbers are available) stood at 3.35, indicating that there are just over three unemployed workers for every online advertised vacancy. Nationally, there are 9.8 million more unemployed workers than advertised vacancies. The number of advertised vacancies exceeded the number of unemployed only in North Dakota, where the Supply/Demand rate was 0.97. States with the next lowest rates included Nebraska (1.41), South Dakota (1.64), New Hampshire (1.65), Vermont (1.68), and Alaska (1.78). The State with the highest Supply/Demand rate is Mississippi (7.12), where there are over 7 unemployed workers for every online advertised vacancy. There are a few States in which there are at least five unemployed for every advertised vacancy. These include Kentucky (5.06), South Carolina (5.02), and Alabama (5.00).
It should be noted that the Supply/Demand rate only provides a measure of relative tightness of the individual State labor markets and does not suggest that the occupations of the unemployed directly align with the occupations of the advertised vacancies (see Occupational Highlights section).
OCCUPATIONAL HIGHLIGHTS
- Demand for workers in Sales and related and Computer and Mathematical Science drops in August
- Demand for Business occupations including Legal, Business and Finance Operations, and Office and Administrative continues to lag
- Demand for workers in Production and Construction jobs has leveled off over the last few months
Changes for the Month of August
Among the top 10 occupation groups with the largest numbers of online advertised vacancies, Healthcare Practitioners and Technical occupations posted the only increase, 26,300, to 513,700. This compensated for part of the July decrease (-61,200), but labor demand in these occupations were still down 98,800 since January 2011. Occupations that experienced August gains included Registered Nurses, Speech-Language Pathologists, Licensed Practical and Licensed Vocational Nurses, Family and General Practitioners, and Occupational Therapists. The number of advertised vacancies in this occupational category continues to outnumber job-seekers by over two to one (0.41 S/D based on July data, the latest unemployment data available).
In August, labor demand for Sales and Related workers declined by 47,800 to 521,900, led by a decrease in demand for Financial Services Sales Agents, Wholesale and Manufacturing Sales Representatives, and Insurance Sales Agents. The decline was much larger than the July decrease (-8,600). The number of unemployed in this occupational category continues to outnumber the number of advertised vacancies by over 2 to 1 (S/D of 2.60).
Labor demand for Computer and Mathematical Science workers declined in August by 40,700 to 532,200, led largely by a decrease in demand for Computer Software Engineers (Applications). The combined July and August drop in advertised vacancies for this occupational category totals almost 70,000; however, job opportunities still remain favorable in this occupational category with 3 ads for every job-seeker (S/D of 0.33).
Demand for Office and Administrative Support occupations fell by 30,000 to 421,700. This followed only a slight July decline (-4,400). Occupations that underwent declines in August included Sales Floor Stock Clerks, First-Line Supervisors/Managers of Office and Administrative Support Workers, Customer Service Representatives, and Receptionists and Information Clerks. The number of unemployed in these occupations remains above the number of advertised vacancies with over 3 (3.54) unemployed for every advertised vacancy.
Food Preparation and Serving Related occupations posted an August drop of 22,200 after experiencing the only July increase (13,700). Responsible for the decline are First-Line Supervisors/Managers of Food Preparation and Serving Workers. Unemployed workers in these occupations outnumber advertised vacancies by 7 to 1.
Supply/Demand for Selected Occupations
“The slowdown in labor demand is not good news for job-seekers in a number of professions,” said Shelp. “Over the last few months, the demand for workers in Production occupations and Construction has leveled off.” While demand is higher than it was at the beginning of the year, the job search is still not easy in these occupations with almost 19 unemployed for every advertised vacancy in construction and 8 job-seekers looking for work in production for every vacancy.
Also, although there is continued demand, the job market is still tough for workers seeking jobs in Food Preparation and Service positions with 7 job-seekers for every advertised opening (July data, the latest unemployment data available). The situation is more favorable for those seeking sales jobs, where there are not quite 3 unemployed for every opening. “Since January, the number of advertised vacancies has risen for workers in Food preparation and service jobs (+10,800), but there are still more unemployed seeking work in these professions than advertised vacancies,” said Shelp.
Labor demand was down since January among a number of high-paying occupations. With the August declines, Computer and Mathematical Science occupations were down 2 percent (-9,500) since January while Management positions were down 7 percent (-30,200). Community and Social Service positions were down 14,000, a drop of 22 percent, since January. However, the job market was not as difficult for these job-seekers. Based on July data, there are about 2 unemployed for every advertised vacancy in Community and social service (2.5) and Management (1.9). In contrast, there are 3 openings for every unemployed job-seeker in Computer and mathematical science (0.33).
METRO AREA HIGHLIGHTS
- Washington, D.C., Oklahoma City, Minneapolis-St. Paul, and Boston have the lowest Supply/Demand rates
In August, 41 of the 52 metropolitan areas for which data are reported separately posted over-the-year increases in the number of online advertised vacancies. Among the three metro areas with the largest numbers of advertised vacancies, the New York metro area was down 7,200 or 2.8 percent below its August 2010 level, and the Washington, DC metro area was down 4,500 or 3.0 percent from last year. In contrast, the Los Angeles metro area was up 9,300 or 6.2 percent above last year’s level.
The number of unemployed exceeded the number of advertised vacancies in all of the 52 metro areas for which information is reported separately. Washington, DC continues to have the most favorable Supply/Demand rate (1.25) with about one advertised vacancy for every unemployed worker. Oklahoma City, Minneapolis-St. Paul, Boston, Honolulu, San Jose, and Baltimore were metropolitan locations where there were just fewer than two unemployed looking for work for every advertised vacancy. On the other hand, metro areas in which the respective number of unemployed is substantially above the number of online advertised vacancies include Riverside, CA — where there are over nine unemployed people for every advertised vacancy (9.37) — Miami (5.56), Sacramento (4.96), Los Angeles (4.37), Memphis (4.34), and Detroit (4.19). Supply/Demand rate data are for June 2011, the latest month for which unemployment data for local areas are available.


