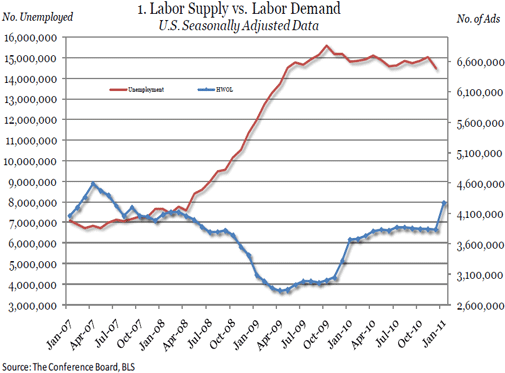
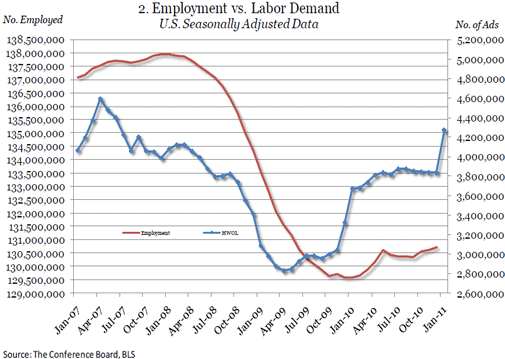
“The very strong seasonal gain to start 2011 is welcome news following seven months of essentially flat U.S. labor demand,” said June Shelp, Vice President at The Conference Board. “Last year, after a promising start (up about 350,000 in January 2010), labor demand fizzled, and the last half of 2010 was actually flat with no appreciable gains in job demand. Hopefully the January 2011 increase suggests that employers are seeing a pickup in their businesses and labor demand will continue to improve throughout this year.”


REGIONAL AND STATE HIGHLIGHTS
- Labor demand rises in January in 49 states and remains unchanged (-200) in Rhode Island
- Large states posting top gains in January include: CA (56,800); TX (31,900); NY (29,400); IL (23,400) and FL (20,200)
Labor demand rose by 148,100 in the South in January and reflected gains across all of the States. Among the larger States in the region, several states posted increases of 10 percent or more in January. Texas (up 31,900 in January) has shown modest but steady growth over the last year. Georgia (up 7,900) continues its upward trend from the last quarter of 2010. Other large states that posted January gains - Florida (+ 20,200), Virginia (+17,000), North Carolina (+10,100) and Maryland (+9,500)- had exhibited a relatively flat trend in labor demand during the last half of 2010. Among the less populous states in the South, South Carolina rose 7,600 after dipping for 5 months, Oklahoma increased 5,200, West Virginia was up 2,900, and Delaware and Arkansas were both up by 2,200.
In January the Midwest increased by 112,900. The largest increase was in Illinois, up 23,400 to 175,400. After a slower second half of 2010, Ohio rose by 18,600, while Wisconsin and Minnesota are up by 11,700 and 11,600, respectively, and Michigan rose by 9,400 in January. Among the States with smaller populations, Missouri rose by 9,000 after a three month fall and Indiana increased by 6,900 while North Dakota and South Dakota rose 1,900 and 1,600, respectively.
The West rose by 105,500, led by California’s gain of 56,800. California has seen a slow yet steady upward growth since October 2009. Along the West Coast, Washington State rose 12,400 in January - its first noteworthy gain since January 2010 – and Oregon was up 8,000. Among the largest mountain states, Arizona and Colorado rose by 8,800 and 7,100, respectively. Other states in the region posting increases include Utah and New Mexico which gained 4,200 and 2,400 respectively.
The Northeast rose 85,000 in January. New York was up 29,400, a welcome gain from its overall sluggish growth pattern in the past year. Pennsylvania gained 18,100 while Massachusetts and New Jersey posted increases of 9,500 and 9,300, respectively. Among the smaller States in New England, Connecticut rose by 9,200 while Maine, New Hampshire, and Vermont were up 1,900, 1,700, and 1,600, respectively. Rhode Island remained virtually unchanged (-200).
The Supply/Demand rate for the U.S. in December (the latest month for which unemployment numbers are available) stands at 3.78, indicating that there are close to 4 unemployed workers for every online advertised vacancy. Nationally, there are 10.6 million more unemployed workers than advertised vacancies. The States where there were fewer than two unemployed for every advertised vacancy included North Dakota and South Dakota (Supply/Demand rates of 1.14 and 1.66 respectively) as well as Nebraska (1.77) and Alaska (1.96). The state with the highest Supply/Demand rate is Mississippi (7.84), where there are almost 8 unemployed workers for every online advertised vacancy. There are a number of states where there are over five unemployed for every advertised vacancy including Kentucky (5.84), Michigan (5.65), Indiana (5.30), South Carolina (5.19), Alabama (5.17), Florida (5.12), and California and Nevada (both with Supply/Demand rates of 5.09).
It should be noted that the Supply/Demand rate only provides a measure of relative tightness of the individual State labor markets and does not suggest that the occupations of the unemployed directly align with the occupations of the advertised vacancies (see Occupational Highlights section).
OCCUPATIONAL HIGHLIGHTS
Labor demand in January:
- Healthcare practitioners up 78,500 and healthcare support up 16,600
- Production jobs rise 12,000
vacancies, labor demand for Healthcare practitioners and technical workers increased by 78,500 in January to 604,400, led by a demand for registered nurses, and family and general practitioners. Healthcare support occupations posted a gain of 16,600 to 143,300. Healthcare support saw an increase in many areas including home health aides, nursing aides, orderlies, and attendants. However, there are over two workers seeking positions in healthcare support for every advertised vacancy (Supply/Demand rate of 2.4) compared to the more favorable market for healthcare practitioners where there are about 3 ads for every job-seeker (S/D of 0.35).
In January, occupations in a variety of office positions posted gains. Management positions rose by 49,000. Management positions that had the largest increase in advertised vacancies included marketing managers, medical and health services managers, and sales managers. Office and administrative support positions were up 38,500. Business and financial occupations rose by 24,100. The seasonal increase in these occupations is a welcome sign since businesses typically do not increase their advertising for workers in these fields in January.
Sales and related positions advanced by 64,400 in January and continue to show strength. Sales representatives, wholesale and manufacturing sales workers (except technical and scientific products), first-line supervisors/managers of retail sales workers, and sales agents in financial services were among the top advertised vacancies in this occupation area. Advertised vacancies in Food preparation and serving jobs rose 10,700. In both areas, however, there are more unemployed workers than advertised vacancies. In food preparation there are almost 9 (8.9) unemployed workers for every advertised vacancy. The S/D rate in sales is somewhat better with 3 unemployed for every advertised vacancy.
Architectural and engineering positions increased 21,200 in January and is now at 166,600. Production work posted an increase of 12,000 to 120,800. There are still 10.6 unemployed for every advertised vacancy in this field.
METRO AREA HIGHLIGHTS
- Washington, D.C., has the lowest Supply/Demand rate
- Online advertised vacancies in all but one of the 52 largest metropolitan areas are above last year’s levels
In January, 51 of the 52 metropolitan areas for which data are reported separately posted over-the-year increases in the number of online advertised vacancies. Salt Lake City, Utah dipped by 300 to 17,400. Among the three metro areas with the largest numbers of advertised vacancies, the New York metro area was 18 percent above its January 2010 level, the Washington, D.C. metro area was 15.4 percent above its January 2010 level, and the Los Angeles metro area was 21.9 percent above last year’s level.
The number of unemployed exceeded the number of advertised vacancies in all of the 52 metro areas for which information is reported separately. Washington, D.C., Boston, Minneapolis-St. Paul, Milwaukee, and Honolulu were the metropolitan locations with the most favorable supply/demand rates, where there were less than two unemployed looking for work was for every advertised vacancy. On the other hand, metro areas in which the respective number of unemployed is substantially above the number of online advertised vacancies include Riverside, CA—where there are over 9 unemployed people for every advertised vacancy (9.83)—Miami (5.95), Sacramento (5.72), and Detroit (5.06).


