
REGIONAL AND STATE HIGHLIGHTS
- All regions of the nation posted gains in May
- Labor demand increased in 18 of the 20 larger States
Among the regions, the South posted the largest gain, 54,000, in May. Maryland led the region with a gain of 14,500, while Texas (+14,200) and Georgia (+13,100) followed close behind. Florida rose by 7,000. Rounding out the most populous States in the South were Virginia (+4,400) and North Carolina (+400). Among the less populous States in the South, Tennessee gained 2,100 and South Carolina rose 1,300 to 50,100 online advertised vacancies in May. Alabama and Delaware were up by 600 and 400 respectively.
In May, the Midwest continued to move forward with its gain of 45,000. Minnesota was the frontrunner with an increase of 14,000. Illinois and Ohio had healthy gains of 11,800 and 10,800 respectively. Among the larger states, Michigan rose by 4,900 to 123,300, Wisconsin rose 2,700 to 95,300, and Missouri was up 2,100 to 84,700. Among the less populous States in the region, Indiana and Iowa both posted losses of 2,700 and 900 respectively. Nebraska, South Dakota, and North Dakota all posted slight gains, 300, 600, and 1,500 respectively.
The West gained 35,100, offsetting its loss from last month. Washington led the region with 12,000 for a total of 116,200. Since the end of 2010, Washington has gained over 27,000. California was up 8,200, while Arizona (down 8,700) posted the largest loss in the region. Colorado and Nevada were both up in May, 5,100 and 5,000 respectively, and labor demand in Utah rose 6,500. Utah’s overall growth this year is 12,700. Oregon grew by 3,300. Some of the less populous States posting increases included Idaho and Alaska, up 3,900 and 1,100 respectively.
The Northeast was up by 18,900 in May. Pennsylvania had the region’s largest gain, 10,100, followed by Massachusetts (+8,800). New Jersey posted a slim 900 increase while New York fell by 7,300 to 267,000. Among the smaller States in New England, Connecticut climbed by 3,400 while Rhode Island and Maine inched up 400 and 300 respectively. New Hampshire and Vermont dipped slightly, down 400 and 100 respectively.
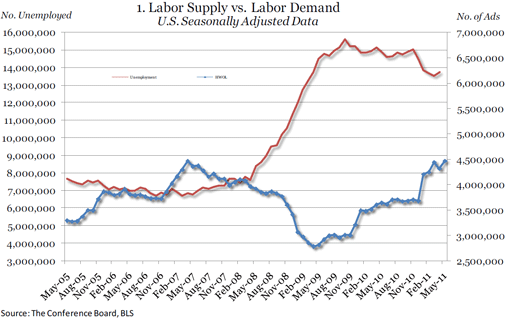
The Supply/Demand rate for the U.S. in April (the latest month for which unemployment numbers are available) stood at 3.18, indicating that there are just over three unemployed workers for every online advertised vacancy. Nationally, there are 9.4 million more unemployed workers than advertised vacancies. In April, there were eight States where there were fewer than two unemployed for every advertised vacancy including North Dakota and Nebraska (Supply/Demand rates of 1.06 and 1.40 respectively) as well as New Hampshire (1.47), Alaska (1.55), Vermont (1.61), South Dakota (1.63), Virginia (1.85), and Maryland (1.92). The State with the highest Supply/Demand rate is Mississippi (7.51), where there are more than 7 unemployed workers for every online advertised vacancy. There are a number of States in which there are over four unemployed for every advertised vacancy including Kentucky (5.21), California (4.52), Alabama (4.50), South Carolina (4.31), Florida (4.15), Michigan (4.08), and Tennessee (4.01).
It should be noted that the Supply/Demand rate only provides a measure of relative tightness of the individual State labor markets and does not suggest that the occupations of the unemployed directly align with the occupations of the advertised vacancies (see Occupational Highlights section).
OCCUPATIONAL HIGHLIGHTS
- In May, 6 of the 22 major occupation groups reported in HWOL rose to all-time highs
- Online advertised vacancies for legal occupations stall
Changes for the Month of May
In May, there were 608,200 advertised vacancies for workers in Computer and mathematical science occupations, a rise of 25,100, reflecting increased demand for a wide range of skills including network designers, biostatisticians, and geographic information system technicians. Building and grounds cleaning & maintenance occupations were up 4,700 to 59,000 with increases for jobs such as building cleaners and landscape workers such as tree trimmers.
Sales and related work rose 23,000 in May to 601,700 and reflected, in part, increased demand for demonstrators and product promoters, sales representatives including insurance and advertising agents, and a gain in the relatively small category of securities and commodity traders which was offset by declines in openings for sales personnel in securities and commodities. Food preparation and serving openings were up 3,000 to 138,300 and reflected increased demand for chefs and head cooks, food service supervisors/managers, and cooks in restaurants and fast-food establishments. “There was also an increase in demand for baristas,” Shelp noted, “but the monthly number of ads is small (less than 2,000).” In both the Sales and Food preparation and serving the number of unemployed outnumbered advertised openings with 2.5 unemployed for every ad in sales and 8.5 more job seekers than openings in food preparation and serving occupations.
Among the top 10 occupation groups with the largest numbers of online advertised vacancies, categories posting increases included Office and administrative support, up 16,900. General office clerks, receptionists, and information clerks were among the occupations that saw increases in advertised vacancies that were partially offset by a drop in demand for billing and accounting clerks and data entry clerks. Management occupations were up 24,600 and reflected increased demand in management areas ranging from construction managers and transportation and distribution managers to financial and compensation and benefits managers. Business and finance rose 23,000 and reflected increases in demand for property and casualty claims examiners, labor relations specialists, and employment interviewers as well as smaller categories like energy auditors and sustainability specialists.
Occupations that posted fewer vacancies in May included Healthcare practitioners and technical occupations, down 3,400 to 565,100. This drop was led by declines in advertised vacancies for speech-language pathologists, occupational therapists, and physical therapists. At the same time Healthcare support occupations rose 4,100 to 133,200. Similar to the decline in healthcare practitioners and technical positions, there were declines in openings for physical therapist assistants and occupational therapist assistants.
Supply/Demand for Selected Occupations
“In May, workers in 6 of 22 of the major occupations groups are finding the number of advertised vacancies is at the highest level since the HWOL series began in May 2005,” said Shelp. (HWOL does not include a separate category for the 23rd major occupation group, military occupations). The previous high for two of the six major occupational groups, Art, design, entertainment, sports and media, and Sales and related occupations were just prior to the official beginning of the recession in December 2007. For Building and grounds cleaning and maintenance and Transportation and material moving, previous highs were in December 2005. These occupational groups include a variety of occupations associated with both real estate and manufacturing (pest control, janitors and house cleaning in real estate and stock clerks, material handles and truck drivers associated with manufacturing output) which had already turned down before the official start of the recession. Computer and mathematical science and Personal care’s previous monthly highs were in early 2008.
Although the number of online advertised vacancies in these occupations is at new highs, the number of unemployed seeking jobs in these six occupational categories is widely different and is reflected in the variation in their Supply/demand rates. In Computer and mathematical sciences occupations (a Supply/Demand rate of 0.23), there are over 4 advertised vacancies for every unemployed job seeker. Although the number of advertised vacancies declined throughout the recession, it never dropped below two openings for every unemployed worker seeking a position. This is in sharp contrast to just over 13 job seekers for every advertised vacancy for Building and grounds cleaning & maintenance occupations (a Supply/Demand rate of 13.4). Supply/demand rates are for April 2011, the latest data available for unemployment.
For other major occupation groups, the number of advertised openings remains below their previous highs. In Business and financial operations and Office administrative support, for example, the number of online advertised vacancies has increased since the end of the recession but remain below their pre-recession levels. Advertised vacancies for Legal occupations have stalled and were 24,800 in May, a monthly number that is in line with the average monthly volume since the official end of the recession in June 2009.
[b]METRO AREA HIGHLIGHTS
- Washington, D.C., Oklahoma City, Honolulu, and Boston have the lowest Supply/Demand rates
In May, all of the 52 metropolitan areas for which data are reported separately posted over-the-year increases in the number of online advertised vacancies. Among the three metro areas with the largest numbers of advertised vacancies, the New York metro area was 11.5 percent above its May 2010 level, the Los Angeles metro area was 15.5 percent above last year’s level, and the Washington, D.C. metro area was 7 percent above its May 2010 level.
The number of unemployed exceeded the number of advertised vacancies in all of the 52 metro areas for which information is reported separately. Washington, DC continues to have the most favorable Supply/Demand rate (1.17) with about one advertised vacancy for every unemployed worker. Oklahoma City, Honolulu, Boston, Baltimore, Minneapolis-St. Paul, and San Jose were metropolitan locations where there were just less than two unemployed looking for work for every advertised vacancy. On the other hand, metro areas in which the respective number of unemployed is substantially above the number of online advertised vacancies include Riverside, CA — where there are over nine unemployed people for every advertised vacancy (9.07) — Sacramento (5.73), Miami (4.96), and Los Angeles (4.42). Supply/Demand rate data are for March 2011, the latest month for which unemployment data for local areas are available.


