The Chained Consumer Price Index for All Urban Consumers increased 0.8 percent in March on a not seasonally adjusted basis. The March level of 118.953 (December 1999=100) was 2.5 percent higher than in March 2006. Please note that the indexes for the post-2005 period are subject to revision.
CPI for All Urban Consumers (CPI-U)
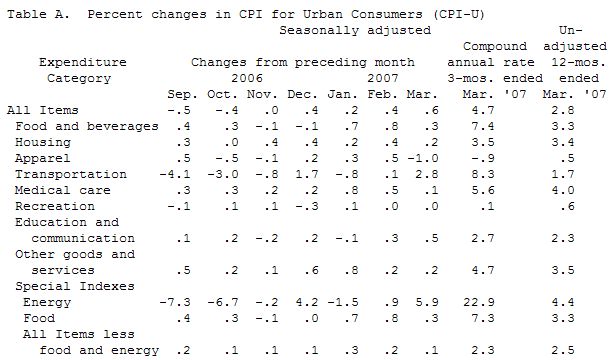
On a seasonally adjusted basis, the CPI-U advanced 0.6 percent in March, following a 0.4 percent increase in February. Overall energy costs increased 5.9 percent in March, with the index for petroleum-based energy up 10.1 percent and the index for natural gas and electricity up 1.3 percent. The food index rose 0.3 percent in March, following larger increases earlier this year. Grocery store foods also rose less in March, largely reflecting a downturn in the index for fruits and vegetables. The index for all items less food and energy advanced 0.1 percent in March, following a 0.2 percent rise in February; the index for shelter rose 0.1 percent after advancing 0.3 percent in February, resulting from a 2.3 percent decline in the index for lodging away from home.
For the first three months of 2007, consumer prices increased at a seasonally adjusted annual rate (SAAR) of 4.7 percent. This compares with an increase of 2.5 percent for all of 2006. The index for energy, which rose 2.9 percent in all of 2006, advanced at a 22.9 percent SAAR in the first quarter of 2007 and accounted for about 41 percent of the first quarter advance in the overall CPI-U. Petroleum-based energy costs and charges for natural gas and electricity contributed about 29 and 12 percent, respectively. The food index rose at a 7.3 percent SAAR in the first quarter of 2007, accounting for 21 percent of the first quarter advance in the overall CPI-U. The index for grocery store food prices increased at a 10.0 percent annual rate, reflecting acceleration over the last year in each of the six major groups. These increases ranged from annual rates of 4.7 percent in the index for cereal and bakery products to 19.3 percent in the index for fruits and vegetables.
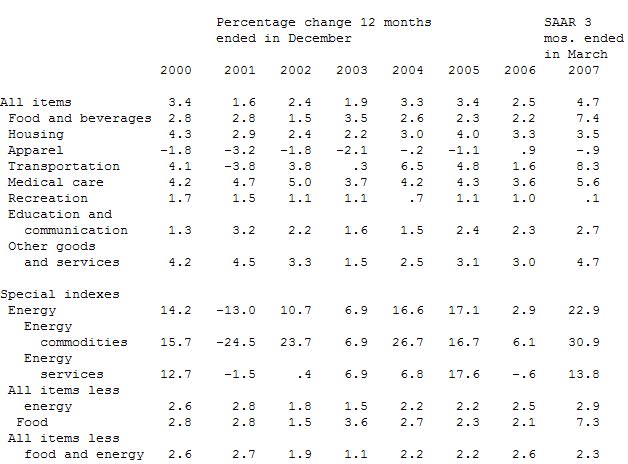
Excluding food and energy, the CPI-U advanced at a 2.3 percent SAAR in the first quarter, following a 2.6 percent rise in all of 2006. The deceleration in the first quarter of 2007 compared with all of 2006 reflects a slower rate of advance in the index for shelter-up at a 2.7 percent SAAR in the first quarter after increasing 4.2 percent in all of 2006-and a downturn in the apparel index. The annual rates for selected groups for the last seven and one-quarter years are shown below.
The food and beverages index rose 0.3 percent in March. The index for food at home, which increased 1.1 percent in February, rose 0.4 percent in March. Downturns in the indexes for fruits and vegetables and for cereal and bakery products were partially offset by larger increases in the indexes for meats, poultry, fish, and eggs, for dairy products, and for nonalcoholic beverages. The index for fruits and vegetables, which rose sharply in January and February, reflecting the effects of adverse weather on supplies, declined 1.4 percent in March. The indexes for fresh fruits and for fresh vegetables declined 2.3 and 1.2 percent, respectively, while the index for processed fruits and vegetables was virtually unchanged. The index for cereal and bakery products declined 0.3 percent after increasing 1.1 percent in February. Conversely, the index for meats, poultry, fish, and eggs, which increased 0.4 in February, advanced 1.1 percent in March. Prices for beef, for pork, for poultry and for other meats all registered increases ranging between 1.0 and 2.0 percent. The index for dairy products rose 1.3 percent, reflecting large increases in prices for cheese and ice cream. The index for nonalcoholic beverages rose 1.7 percent, largely as a result of a 2.8 percent increase in the index for carbonated drinks. The index for other food at home increased 0.2 percent. The other two components of the food and beverages index-food away from home and alcoholic beverages--increased 0.1 and 0.6 percent, respectively.
The index for housing rose 0.2 percent in March, following a 0.4 percent increase in February. The index for shelter increased 0.1 percent in March, following increases of 0.3 percent in each of the preceding three months. Within shelter, the indexes for rent and owners' equivalent rent each increased 0.3 percent, while the index for lodging away from home declined 2.3 percent. (Prior to seasonal adjustment, the index for lodging away from home increased 2.2 percent.) The index for fuels and utilities increased 1.2 percent in March, the same as in February. The index for fuel oil rose 3.8 percent in March. The index for natural gas advanced sharply for the second consecutive month-up 3.0 percent in March. Charges for electricity increased 0.5 percent in March. The index for household furnishings and operations rose 0.2 percent in March, the same as in February.
The transportation index rose 2.8 percent in March, reflecting a 10.6 percent increase in the index for motor fuels. (Prior to seasonal adjustment, gasoline prices rose 13.0 percent in March and were 7.2 percent higher than a year ago, but 13.8 percent lower than their peak level recorded in July 2006.) The index for new vehicles rose 0.3 percent in March, its first advance since a 0.1 percent rise in July last year. (Prior to seasonal adjustment, new vehicle prices declined 0.1 percent in March and were 1.1 percent lower than in March 2006.) The index for used cars and trucks decreased 0.2 percent in March. The index for public transportation rose 0.1 percent in March, as a 0.3 percent increase in the index for airline fares more than offset a 1.1 percent decline in the index for other intercity transportation. (Prior to seasonal adjustment, airline fares rose 1.5 percent.)
The index for apparel declined 1.0 percent in March, following a 0.5 percent in increase in February. (Prior to seasonal adjustment, apparel prices rose 3.0 percent, reflecting the continued introduction of spring-summer wear. Prices for women's and girls' apparel registered the largest advance-up 5.4 percent.)
Medical care costs rose 0.1 percent in March and are 4.0 percent higher than a year ago. The index for medical care commodities-prescription drugs, nonprescription drugs, and medical supplies-decreased 0.3 percent. The index for medical care services advanced 0.2 percent. The indexes for professional services and for hospital and related services increased 0.1 and 0.4 percent, respectively.
The index for recreation was virtually unchanged in March. Increases in the indexes for admissions to movies, theaters, concerts, and sporting events, for fees for lessons and instructions, and for sporting goods-up 0.6, 0.8 and 0.4 percent, respectively--offset declines in the indexes for video and audio, for photography, and for toys.
The index for education and communication increased 0.5 percent in March. Educational costs rose 0.6 percent, reflecting a 1.7 percent increase in educational books and supplies. The index for communication costs rose 0.3 percent. Within the communication group, the index for telephone services rose 0.4 percent. Land-line local and long distance charges increased 0.5 and 0.9 percent respectively, while wireless telephone service charges were unchanged. The indexes for personal computers and peripheral equipment and for internet services and electronic information providers turned up in March, each advancing 0.2 percent, while the index for computer software and accessories declined 0.5 percent.
The index for other goods and services increased 0.2 percent in March. The index for tobacco and smoking products rose 0.2 percent, following large increases in each of the preceding three months. The index for personal care increased 0.1 percent.
CPI for Urban Wage Earners and Clerical Workers (CPI-W)
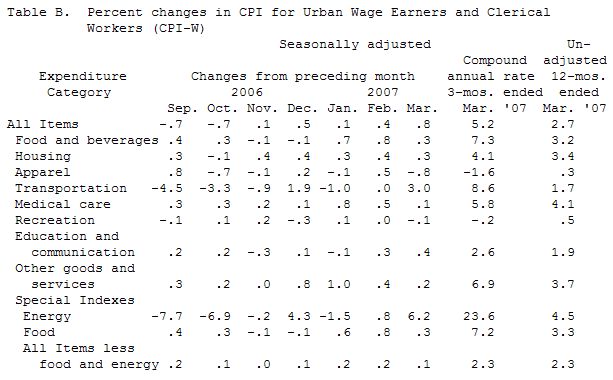
On a seasonally adjusted basis, the CPI for Urban Wage Earners and Clerical Workers increased 0.8 percent in March.