The Chained Consumer Price Index for All Urban Consumers (C-CPI-U) increased 0.4 percent in May on a not seasonally adjusted basis. The May level of 120.032 (December 1999=100) was 2.3 percent higher than in May 2006. Please note that the indexes for the post-2005 period are subject to revision.
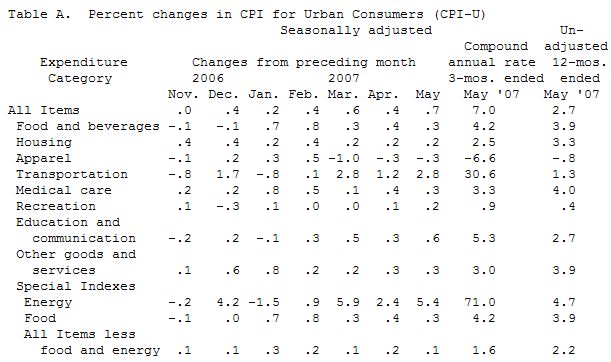
CPI for All Urban Consumers (CPI-U)
On a seasonally adjusted basis, the CPI-U advanced 0.7 percent in May, following a 0.4 percent increase in April. The index for energy increased sharply for the third consecutive month-up 5.4 percent in May. The index for petroleum-based energy rose 9.8 percent while the index for energy services declined 0.2 percent. The food index rose 0.3 percent in May, slightly less than in April. The index for all items less food and energy advanced 0.1 percent in May, following a 0.2 percent rise in April. Smaller increases in the indexes for shelter and medical care were responsible for the moderation.
During the first five months of 2007, the CPI-U rose at a 5.5 percent seasonally adjusted annual rate (SAAR). This compares with an increase of 2.5 percent for all of 2006. The acceleration thus far this year was due to larger increases in the energy and food components. The index for energy advanced at a 36.0 percent SAAR in the first five months of 2007 compared with 2.9 percent in 2006. Petroleum-based energy costs increased at a 63.9 percent annual rate and charges for energy services rose at a 6.8 percent annual rate. The food index has increased at a 6.2 percent SAAR thus far this year, following a 2.1 percent rise for all of 2006. Excluding food and energy, the CPI-U advanced at a 2.1 percent SAAR in the first five months, following a 2.6 percent rise for all of 2006.
The food and beverages index rose 0.3 percent in May. The index for food at home increased 0.4 percent, following a 0.5 percent rise in April. The index for meats, poultry, fish, and eggs registered a substantial increase for the third consecutive month-up 1.2 percent in May. The indexes for pork and for other meats turned up in May after declining in April, advancing 2.0 and 0.8 percent, respectively. Poultry prices rose 0.8 percent; beef prices slowed from their recent trend, increasing 0.1 percent. Through the first five months of 2007, beef prices have risen 5.1 percent, poultry prices, 4.3 percent, and pork prices, 3.4 percent. The index for fruits and vegetables, which rose 0.4 percent in April, declined 0.5 percent in May. (Prior to seasonal adjustment, prices for fruits and vegetables rose 1.0 percent.) The indexes for fresh vegetables and for processed fruits and vegetables declined 1.8 and 0.3 percent, respectively, while the index for fresh fruits increased 0.7 percent. The index for dairy products increased 0.5 percent as a 2.2 percent increase in milk prices more than offset a 0.4 percent decline in prices for cheese. The index for nonalcoholic beverages rose 0.9 percent, reflecting an upturn in prices for carbonated drinks and for coffee. The indexes for cereal and bakery products and for other food at home were each virtually unchanged in May. The other two components of the food and beverages index-food away from home and alcoholic beverages-each increased 0.2 percent.
The index for housing increased 0.2 percent in May, the same as in each of the two preceding months. The index for shelter rose 0.2 percent in May, following an increase of 0.3 percent in April. Within shelter, the index for rent rose 0.3 percent; the index for owners' equivalent rent, 0.1 percent; and the index for lodging away from home, 1.6 percent. The index for household energy declined 0.1 percent as a 0.9 percent decrease in the index for natural gas was partially offset by increases in the indexes for fuel oil and for electricity-up 1.9 and 0.1 percent, respectively. (Prior to seasonal adjustment, charges for electricity rose 1.7 percent, reflecting the switch to seasonal rates in some areas.) The index for household furnishings and operations was virtually unchanged in May.
The transportation index rose sharply for the third consecutive month- up 2.8 percent in May. A 10.4 percent increase in the index for motor fuels was partially offset by declines in the indexes for new and used vehicles and for public transportation. (Prior to seasonal adjustment, gasoline prices rose 9.5 percent. As of May, the price of gasoline was 4.0 percent higher than its previous peak level recorded in July 2006.) The index for new vehicles declined 0.2 percent, while the index for used cars and trucks increased 0.1 percent. During the last 12 months, new vehicle prices have declined 1.0 percent and prices for used cars and trucks, 4.6 percent. The index for public transportation declined 0.5 percent in April, reflecting a 0.6 percent decrease in the index for airline fares. (Prior to seasonal adjustment, airline fares rose 0.4 percent.)
The index for apparel declined 0.3 percent in May the same as in April. (Prior to seasonal adjustment, apparel prices decreased 1.2 percent. Prices for women's and girls' apparel registered the largest decline-down 2.3 percent.)
Medical care costs rose 0.3 percent in May and are 4.0 percent higher than a year ago. The index for medical care commodities-prescription drugs, nonprescription drugs, and medical supplies-was virtually unchanged. The index for medical care services rose 0.4 percent. The indexes for professional services and for hospital and related services increased 0.2 and 0.7 percent, respectively.
The index for recreation rose 0.2 percent in May. The index for cable and satellite television and radio service increased 1.0 percent. This increase was partially offset by a 3.1 percent decline in the index for televisions. Television prices have declined 26.9 percent during the 12 month period ended in May.
The index for education and communication advanced 0.6 percent in May. Educational costs rose 0.4 percent and the index for communication costs increased 0.7 percent. Within the communication group, the index for telephone services rose 0.9 percent. Land-line local service charges increased 0.3 percent, land-line long distance charges advanced 2.7 percent, while wireless telephone service charges declined 0.1 percent. The indexes for personal computers and peripheral equipment declined 2.0 percent. The index for internet services and electronic information providers advanced for the third consecutive month-up 0.1 percent in May--but was 23.6 percent lower than a year ago.
The index for other goods and services increased 0.3 percent in May. The index for tobacco and smoking products rose 0.4 percent, following a 0.4 percent decline in April. The index for miscellaneous personal services rose 0.3 percent, reflecting increases for legal and for financial services, each up 0.5 percent.
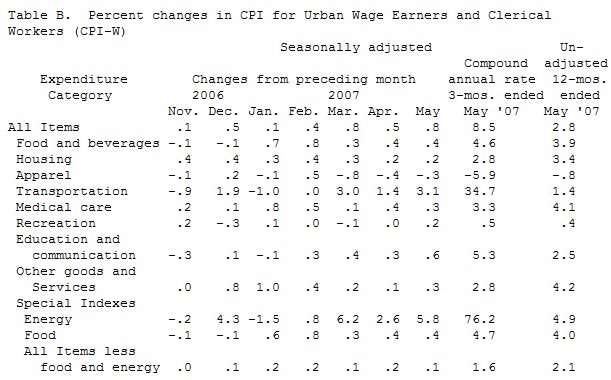
CPI for Urban Wage Earners and Clerical Workers (CPI-W)
On a seasonally adjusted basis, the CPI for Urban Wage Earners and Clerical Workers increased 0.8 percent in May.