


The recent blowup at American Home Mortgage is a reminder that the mortgage markets are very panicked and illiquid right now. American Home customers generally had good credit histories — an indication that the mortgage mess is no longer confined to risky subprime borrowers. Through the rest of this year and into next, a raft of adjustable-rate mortgages will begin adjusting to higher interest rates. The higher monthly payments may very well squeeze even borrowers with good credit histories, leading to a new round of mortgage defaults.
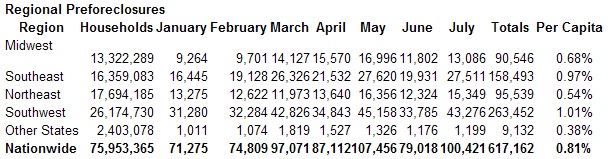
On a per-capita basis for the first seven months of 2007, 9 pre-foreclosures were filed for every 1,000 households (567,046 total filings), up more than 27 percent from nearly 7 filings per 1,000 households. That’s also up more than 83 percent from the 4.9 filings per 1,000 households for the same period a year ago, reports ForeclosureS.com, based on analysis of its nearly 3.5 million listings in more than 1,590 counties across the country.
Pre-foreclosure filings indicate homeowners that are in default on their mortgages, facing potential foreclosure, and trying to work out their financial problems. It includes notice of default filings or notice of foreclosure auction filings.
Here’s a month-by-month snapshot of how each Region is doing year-to-date. Notice the 27% jump from June to July in new pre-foreclosure filings.
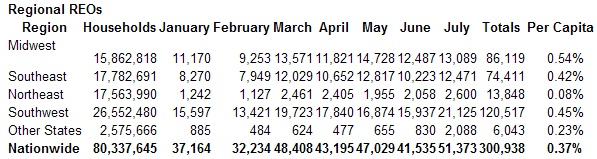
Thousands of additional homeowners already lost their properties to foreclosure so far this year, too. As measured by REO (real estate owned by a bank or lender) filings, year to date, 3.7 properties for every 1,000 households in the United States have been lost to foreclosure. That’s up 24 percent from per capita numbers during the first half of 2007 and represents a total 294,539 REO filings (filing numbers are up 18.8 percent from the first seven months of the year).
Here’s a month-by-month snapshot of how each *Region is doing year-to-date. Notice the 24% jump from June to July in houses lost to foreclosure (REO).
“The foreclosure outlook is not good, but it is not a cause for panic,” adds McGee. “In spite of the housing industry’s troubles, the nation’s economy, as measured by the 3.4 percent second-quarter growth in the U.S. gross domestic product (GDP), is going strong, and so is current consumer confidence in it.”
What’s really happening in the market goes beyond subprime loans — those issued to people with little or no credit — gone bad and subsequent foreclosure fallout. “The big picture is that the formerly artificial, overzealous housing and loose credit markets have adjusted too firmly and a clampdown in liquidity is the result. Liquidity refers to the availability of money to lend for housing for everyone.
“For the past few years as home prices appreciated almost out of control, so did the artificial and ‘creative’ financing environment that helped people who couldn’t really afford it buy their homes. Now, thanks to Freddie Mac’s lead in tightening lending qualification standards earlier this year, lenders are being extremely cautious on all levels. Home loans and refinancings now are being made only if potential borrowers meet full documentation income qualifications necessary to afford those mortgages,” says McGee.
“We went from ‘irrational exuberance’ in the housing and credit markets to fear and blood on the streets very quickly. We need to get to a place where it’s a balanced financing environment again to help stabilize our housing markets.”
“The foreclosures will work their way through. As they do in the coming months, we’ll see more and more REO properties and REO auctions (Please see REO Auction Update below),” adds McGee. “What worries me more about the future is a lack of liquidity in the market for all borrowers in general. What’s happening now with subprime and now alt-a lenders collapsing, lenders exiting the subprime market, industry consolidations, bankruptcies, and more, is that the institutional investors that provide cash to lending markets are panicking and pulling their money out.
“With tighter credit, fewer people will be able to qualify for home loans. As a result, we can expect to see a drop in overall homeownership rates nationwide — currently at an all-time high of 69 percent. Many of those people who lose their homes to foreclosure won’t get back into homeownership until they raise their income years later to better afford it.”
Let’s look closer at a few more July 2007 pre-foreclosure statistics from ForeclosureS.com:
* The Top 10 Counties nationwide for pre-foreclosures on a per capita basis, July year-to-date (they’re actually 11 because of a three-way tie for last place) include:
- Alpine County, California (that state's smallest county and in the Sierra Nevada): 39.3 filings per 1,000 households
- Lee County, Florida (which includes Cape Coral-Fort Myers area): 36.2 filings per 1,000 households
- Kendall County, Illinois (southwest of Chicago): 35.4 filings per 1,000 households
- Wasatch County, Utah (southeast of Salt Lake City): 34.4 filings per 1,000
- Pinal County, Arizona (south of Phoenix): 33.3 filings per 1,000
- Flagler County, Florida (north of Daytona Beach and including Palm Coast): 32.8 filings per 1,000
- Valencia County, New Mexico (south of Albuquerque): 32.4 filings per 1,000
- Clark County, Nevada (which includes Las Vegas): 32.2 filings per 1,000
- Rockwall County, Texas (part of the Dallas-Fort Worth metroplex): 31.7 filings per 1,000 households
- Osceola County, Florida (south of Orlando and includes Kissimmee): 31.7 filings per 1,000 households
- Riverside County, California (which includes part of Greater Los Angeles): 31.7 filings per 1,000 households
* On strictly number of filings basis, seven of the above 10 counties showed triple digit increases in pre-foreclosure filings year-to-date 2007 vs. the same time a year ago.
* Kendall County, Illinois, for example, had 666 pre-foreclosure filings year-to-date, up 100 percent from the 333 the same time a year ago. It’s also the second fastest-growing county in the United States behind Flagler County, Florida (pre-foreclosure filings up 274 percent), and just ahead of Rockwall County, Texas, according to U.S. Census data. Pinal County, Arizona (Census ranks it as the sixth-fastest growing county) had a 180 percent increase in pre-foreclosure numbers.
* On the basis of pre-foreclosure filings per capita year-to-date, the top five states include Nevada (25.5 filings per 1,000 households; 19,044 actual filings), Florida (17.6 filings per 1,000 households; 111,020 actual filings), Colorado (14.5 filings per 1,000 households; 20,382 actual filings), Illinois (13.5 filings per 1,000 households; 52,696 actual filings), and New Jersey (12.2 filings per 1,000 households; 37,250 actual filings).
* California, perennial numbers leader in terms of pre-foreclosure filings, comes in sixth on a per capita basis with 11.5 filings out of every 1,000 households in the state (132,101 actual filings).
* The nation’s Southeast Region took over first place from the Southwest with 11.7 pre-foreclosures per 1,000 households in the region year-to-date.
Looking at July foreclosure numbers as measured by REO filings from ForeclosureS.com:
* States with the highest per capita numbers of properties lost to foreclosure year-to-date include Colorado in a tie with Michigan (9.4 foreclosures for every 1,000 households; 14,736 and 18,788 REO filings year-to-date respectively), Nevada (9.3 filings per 1,000 households), Georgia (8.5 filings per 1,000 households), and Indiana (7.8 filings for every 1,000 households).
* On a brighter note, however, in hard-hit-by-foreclosures Colorado a number of counties, including Adams, Arapahoe, and Denver, the number of REO filings actually was down year-to-date.
* The heavily industrialized and hard-hit by layoffs Midwest Region had the highest per capita incidence of foreclosure nationwide this year with 5.5 REO filings for every 1,000 households in the region.
* Michigan, Indiana, Ohio (6.7 filings per 1,000 households), and Missouri (6.6 filings for every 1,000 households) all were among the nation’s top 10 in terms of per capita REO filings year to date.
* The Northeast Region trails the rest of the nation in terms of REO filings per capita, with less than one filing for every 1,000 households.
* The Top 10 Counties nationwide for foreclosures on a per capita basis year to date include:
- Costilla County, Colorado (in rural southern Colorado): 253.5 REO filings per 1,000 households.
- Valencia County, New Mexico: 47.3 filings per 1,000 households.
- Elko County, Nevada (in the northeastern part of that state): 37.6 filings per 1,000 households).
- Mohave County, Arizona (in northwestern Arizona and includes Lake Havasu City and Kingman): 35.8 filings per 1,000 households.
- Hood County, Texas (part of Dallas-Fort Worth Metroplex): 32.3 filings per 1,000 households.
- Tangipahoa Parish, Louisiana (north of Lake Pontchartrain and bordering Mississippi): 31.3 filings per 1,000 households.
- Weld County, Colorado (north of Denver along Colorado's Front Range): 28.4 filings per 1,000 households.
- Garland County, Arkansas (southwest of Little Rock): 26.3 filings per 1,000 households.
- Modoc County, California (heavily rural in northeastern California): 25.6 filings per 1,000 households.
- Elbert County, Colorado (east of Denver metropolitan area with an urban/rural mix): 21 filings per 1,000 households.
