


From the start of the recession in December 2007 through December 2008, the total number of mass layoff events (seasonally adjusted) was 23,485, and the number of initial claims (seasonally adjusted) was 2,394,434.
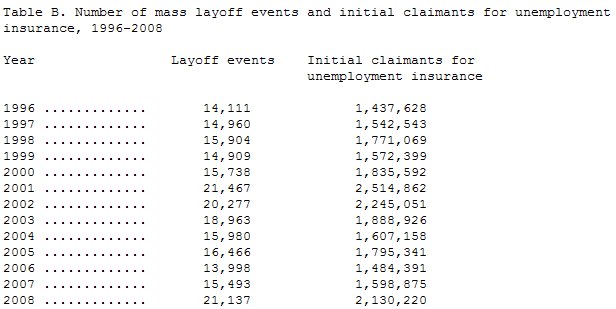
For all of 2008, on a not seasonally adjusted basis, the total numbers of mass layoff events at 21,137, and initial claims at 2,130,220, reached their highest annual levels since 2001 and 2002, respectively. Among the twenty-one major industry sectors, six registered series highs for both mass layoff events and initial claims for all of 2008 - construction; transportation and warehousing; finance and insurance; real estate and rental and leasing; management of companies and enterprises; and accommodation and food services. Eleven states recorded series highs in mass layoff initial claims activity (with data available back to 1996).
The national unemployment rate was 7.2 percent in December, seasonally adjusted, up from 6.8 percent the prior month and from 4.9 percent a year earlier. In December, total nonfarm payroll employment decreased by 524,000 over the month and by 2,589,000 from a year earlier.
Industry Distribution (Not Seasonally Adjusted)
The number of mass layoff events in December was 3,377 on a not seasonally adjusted basis; the number of associated initial claims was 351,305. (See table 2.) Both the number of events and initial claimants reached their highest December levels in program history (with data available back to 1995). Twelve major industry sectors reported program highs in terms of initial claimants for the month of December - mining; construction; manufacturing; wholesale trade; transportation and warehousing; finance and insurance; real estate and rental and leasing; management of companies and enterprises; administrative and waste services; educational services; accommodation and food services; and other services, except public administration.
The manufacturing sector accounted for 41 percent of all mass layoff events and 49 percent of initial claims filed in December 2008; a year earlier, manufacturing made up 32 percent of events and 41 percent of initial claims. This December, the number of manufacturing claimants was greatest in transportation equipment (64,336), followed by plastics and rubber products (14,215) and fabricated metal products (12,576). (See table 3.) The construction industry accounted for 16 percent of mass layoff events and 12 percent of associated initial claims during the month.
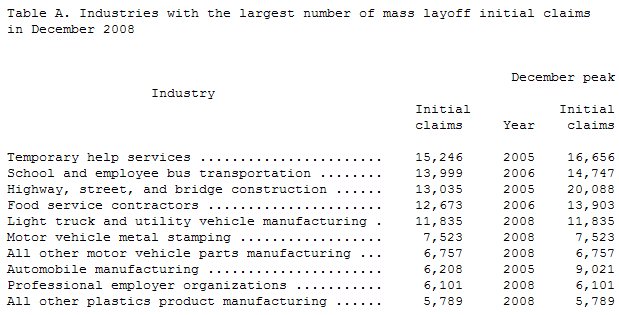
The six-digit NAICS industry with the largest number of initial claims was temporary help services (15,246), followed by school and employee bus transportation (13,999) and highway, street, and bridge construction (13,035). Among the 10 industries with the highest levels of initial claims, 5 of the 10 - all other plastics product manufacturing, light truck and utility vehicle manufacturing, motor vehicle metal stamping, all other motor vehicle parts manufacturing, and professional employer organizations - reached program highs in 2008 for the month of December (with data available back to 1995). (See table A.)
Geographic Distribution (Not Seasonally Adjusted)
Of the 4 census regions, the Midwest had the highest number of initial claims due to mass layoffs in December (146,155), followed by the South (94,307), the West (65,942), and the Northeast (44,901). (See table 5.) Initial claims associated with mass layoffs increased over the year in all 4 regions, with the Midwest (+48,809) and the South (+46,802) experiencing the largest increases. In 2008, the Northeast and the South regions reported their highest December levels of initial claims in program history (with data available back to 1995).
Of the 9 geographic divisions, the East North Central (108,017) and the Pacific (53,162) had the highest numbers of initial claims due to mass layoffs in December. (See table 5.) All 9 divisions experienced over-the-year increases in initial claims, led by the East North Central (+33,643) and the East South Central (+23,850). This year, the Middle Atlantic, West North Central, East South Central, West South Central, and Mountain divisions reached their highest levels of initial claims for December in program history.
California recorded the highest number of initial claims filed due to mass layoff events in December with 43,265. The states with the next highest number of mass layoff initial claims were Ohio (27,836), Illinois (25,885), and Michigan (24,508). (See table 6.) In 2008, 13 states reached program highs in initial claims for the month of December - Alabama, Colorado, Florida, Hawaii, Kansas, Kentucky, Louisiana, Mississippi, Nevada, North Carolina, North Dakota, Ohio, and Tennessee. Forty-two states and the District of Columbia registered over-the-year increases in initial claims associated with mass layoffs,led by Ohio (+12,927), California (+12,675), Illinois (+10,873), and Alabama (+10,483).
Review of 2008
For all of 2008, the total numbers of mass layoff events at 21,137, and initial claims, at 2,130,220, reached their highest annual levels since 2001 and 2002, respectively. (See table B.)
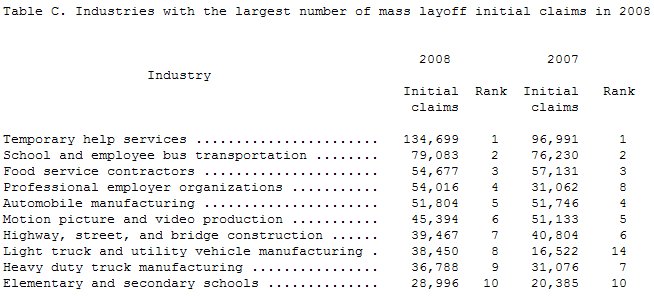
The 10 detailed industries with the highest number of mass layoff initial claims in 2008 accounted for 26 percent of the total for the year. (See table C.) Temporary help services, school and employee bus transportation, and food service contractors ranked first, second, and third among the 10 industries in both 2008 and 2007. In 2008, light truck and utility vehicle manufacturing entered the top 10 industries in terms of initial claims, displacing discount department stores.
Manufacturing accounted for 33 percent of all mass layoff events and 41 percent of initial claims filed during 2008, up slightly from 2007 (30 and 38 percent, respectively). The number of manufacturing claimants was highest in transportation equipment manufacturing, 323,676, followed by food manufacturing, 72,081, and wood product manufacturing, 56,374.
Among the major industry sectors, manufacturing had the largest over-the-year increase in mass layoff-related initial claims (+260,213) from 2007 to 2008. Within manufacturing, transportation equipment (+95,463), plastics and rubber products (+24,638), and fabricated metal products (+23,083) experienced the largest increases from the previous year. Administrative and waste services had the second largest
increase (+78,183) among the major industry sectors, due to more layoff activity in administrative and support services (+77,864).
Among the twenty-one major industry sectors, six registered series highs for both mass layoff events and initial claims for all of 2008 -construction; transportation and warehousing; finance and insurance; real estate and rental and leasing; management of companies and enterprises; and accommodation and food services.
The Midwest reported the highest number of initial claims filed due to mass layoffs during 2008 (676,591). Layoffs in transportation equipment manufacturing accounted for 30 percent of the claims in the Midwest. Fabricated metal product manufacturing, machinery manufacturing, and administrative and support services, together accounted for an additional 17 percent of layoffs in that region in 2008. The fewest number of mass layoff initial claims during 2008 was reported in the Northeast (316,191).
From 2007 to 2008, all 4 regions had over-the-year increases in the number of initial claims from mass layoffs, led by the South (+176,875) and Midwest (+167,160). All 9 geographic divisions also experienced higher claimant activity in mass layoffs when compared with 2007, with the largest increases occurring in the East North Central (+123,510), the Pacific (+117,939), and the East South Central (+65,588).
Among the 50 states and the District of Columbia, California recorded the largest number of initial claims (446,480) filed in mass layoff events during 2008, accounting for 21 percent of the national total. The states with the next highest numbers of initial claims were Michigan (132,468), Ohio (131,813), Pennsylvania (128,041), and Illinois (103,685). Eleven states--Florida, Hawaii, Indiana, Kentucky, Montana, New Mexico, New York, North Dakota, Tennessee, Vermont, and Wyoming - recorded series highs in mass layoff claimant activity in 2008, while
two states - Maine and Virginia - reported series lows.
For all of 2008, California reported the largest over-the-year increase in initial claims (+88,486), followed by Ohio (+48,384) and Florida (+38,960). The largest over-the-year decreases were reported in Maryland (-5,056), Virginia (-4,758), and New Jersey (-1,115).
